
Monitor your JD Edwards platform with the new Oracle APM
Introduction
Oracle released OCI Application Performance Monitoring last month, as part of the Observability and Management platform.
An APM solution was already there in OCI (and is still there), as part of the Oracle Management Cloud Platform - OMC so the first question we could have is : why having 2 solutions for the same objective ?
First of all, the new APM solution is a native OCI service where the previous one comes from Enterprise Manager : as such the new service provides a tighter integration with OCI, multi-region availability, security and fine-grained control. It’s a good fit for customers having multiple OCI services to run their workloads, legacy and Cloud-Native solutions, when they want a centralized, integrated monitoring solution.
Secondly, both solutions will co-exist and OMC is still being developed, enhanced as the new version, 1.5.3, was also just released.
Before going deeper in APM and how it can be integrated easily with JD Edwards platform, let’s just present the different services part of the Observability & Management platform (full description here : Oracle Cloud Observability and Management Platform):
- Application Performance Monitoring (APM) : observability capabilities for end-to-end visibility and diagnosis across the entire IT environment
- Logging Analytics : a machine learning-based cloud service that monitors, aggregates, indexes, and analyzes all log data from on-premises and multicloud environments
- Operations Insights : empowers IT operations staff to optimize for performance by quickly analyzing performance patterns over time
- Database Management : unified console for on-premises and cloud databases with lifecycle database management capabilities for monitoring, performance management, tuning, and administratio
- Management Agent : collect data from services and sources that you want to monitor (free service); uses OpenTracing standards
- … other services will come soon
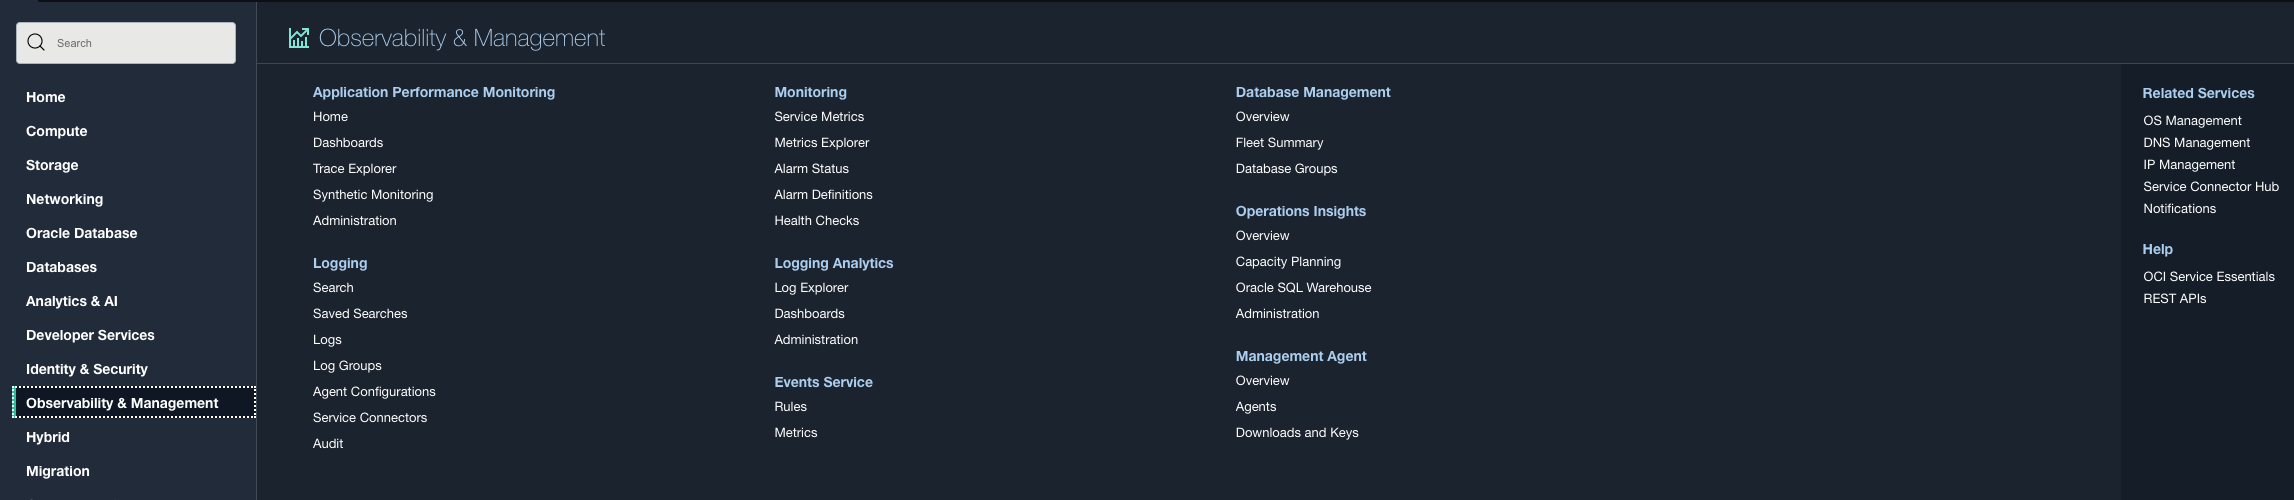
Those services are are grouped under the new “Observability & Management” section:
APM has still some limitations compared to the existing version but is already promising and it will evolve very quickly and I think it will surpass it in the near future. One of missing feature I am looking forward is custom dashboards so we could build monitoring dashboards targeted for a JD Edwards platform.
Dashboards
Here are the 2 dashboards and 1 trace explorer query you can use to monitor your JD Edwards :
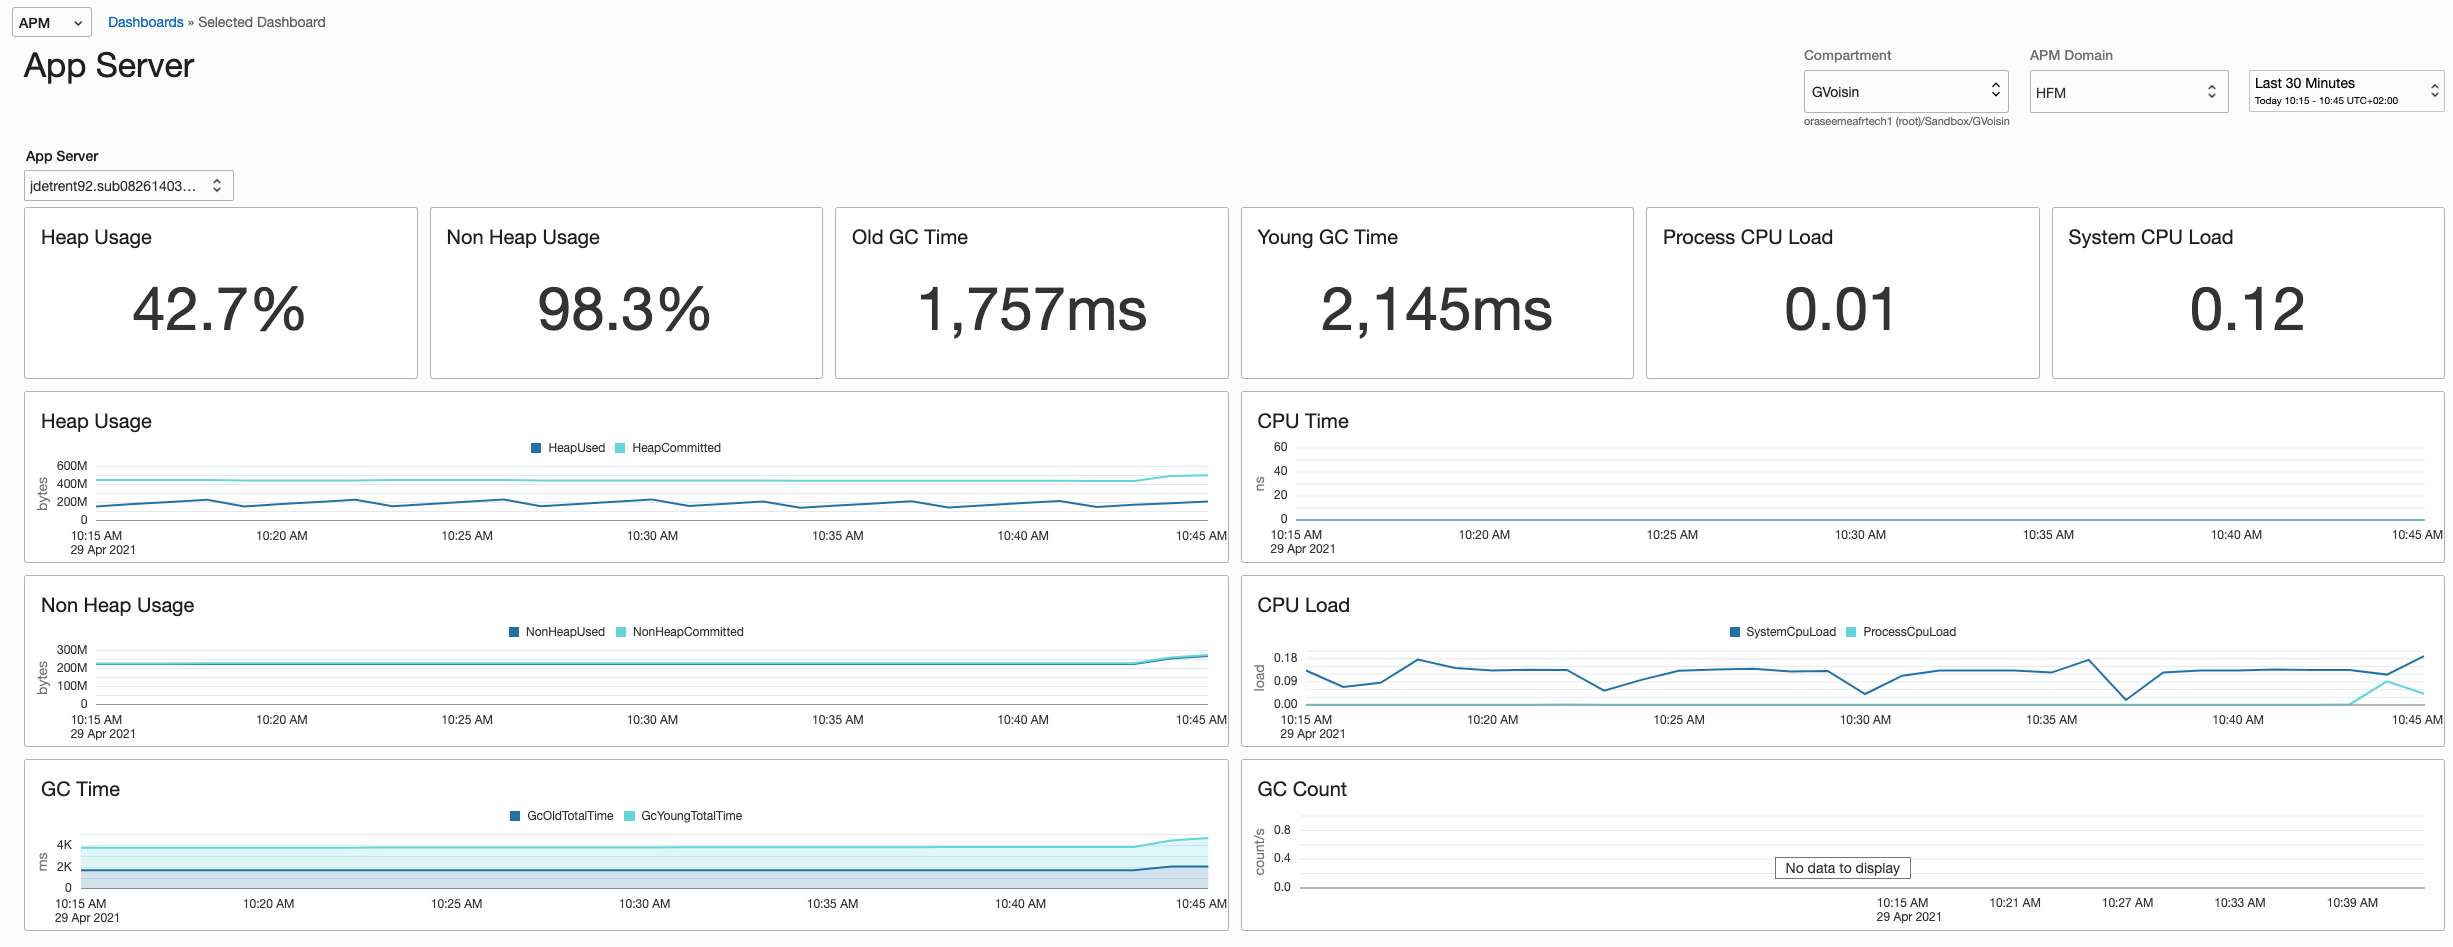
- Web servers : WebLogic server activity
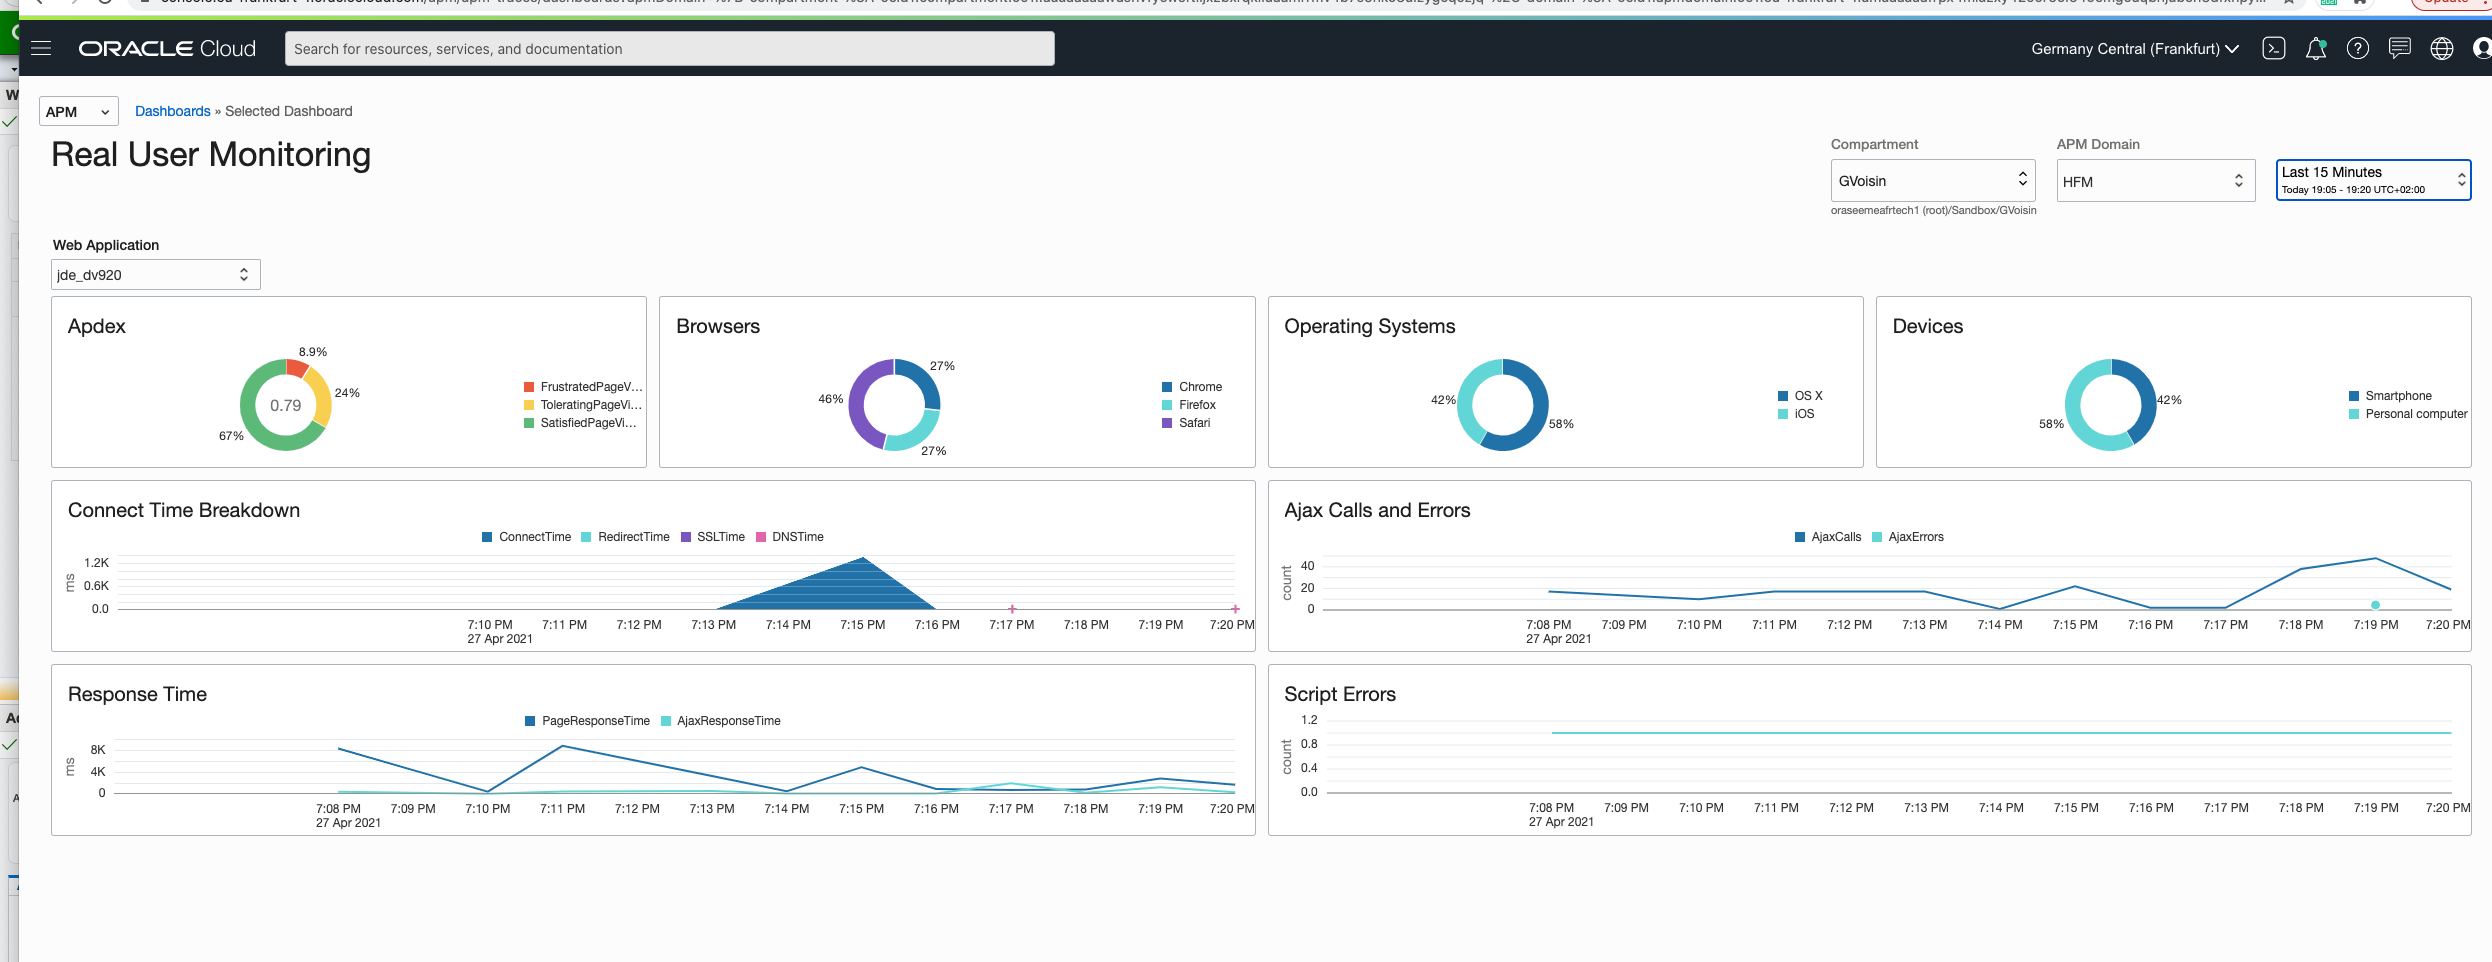
- Web users: end users browser activity monitoring
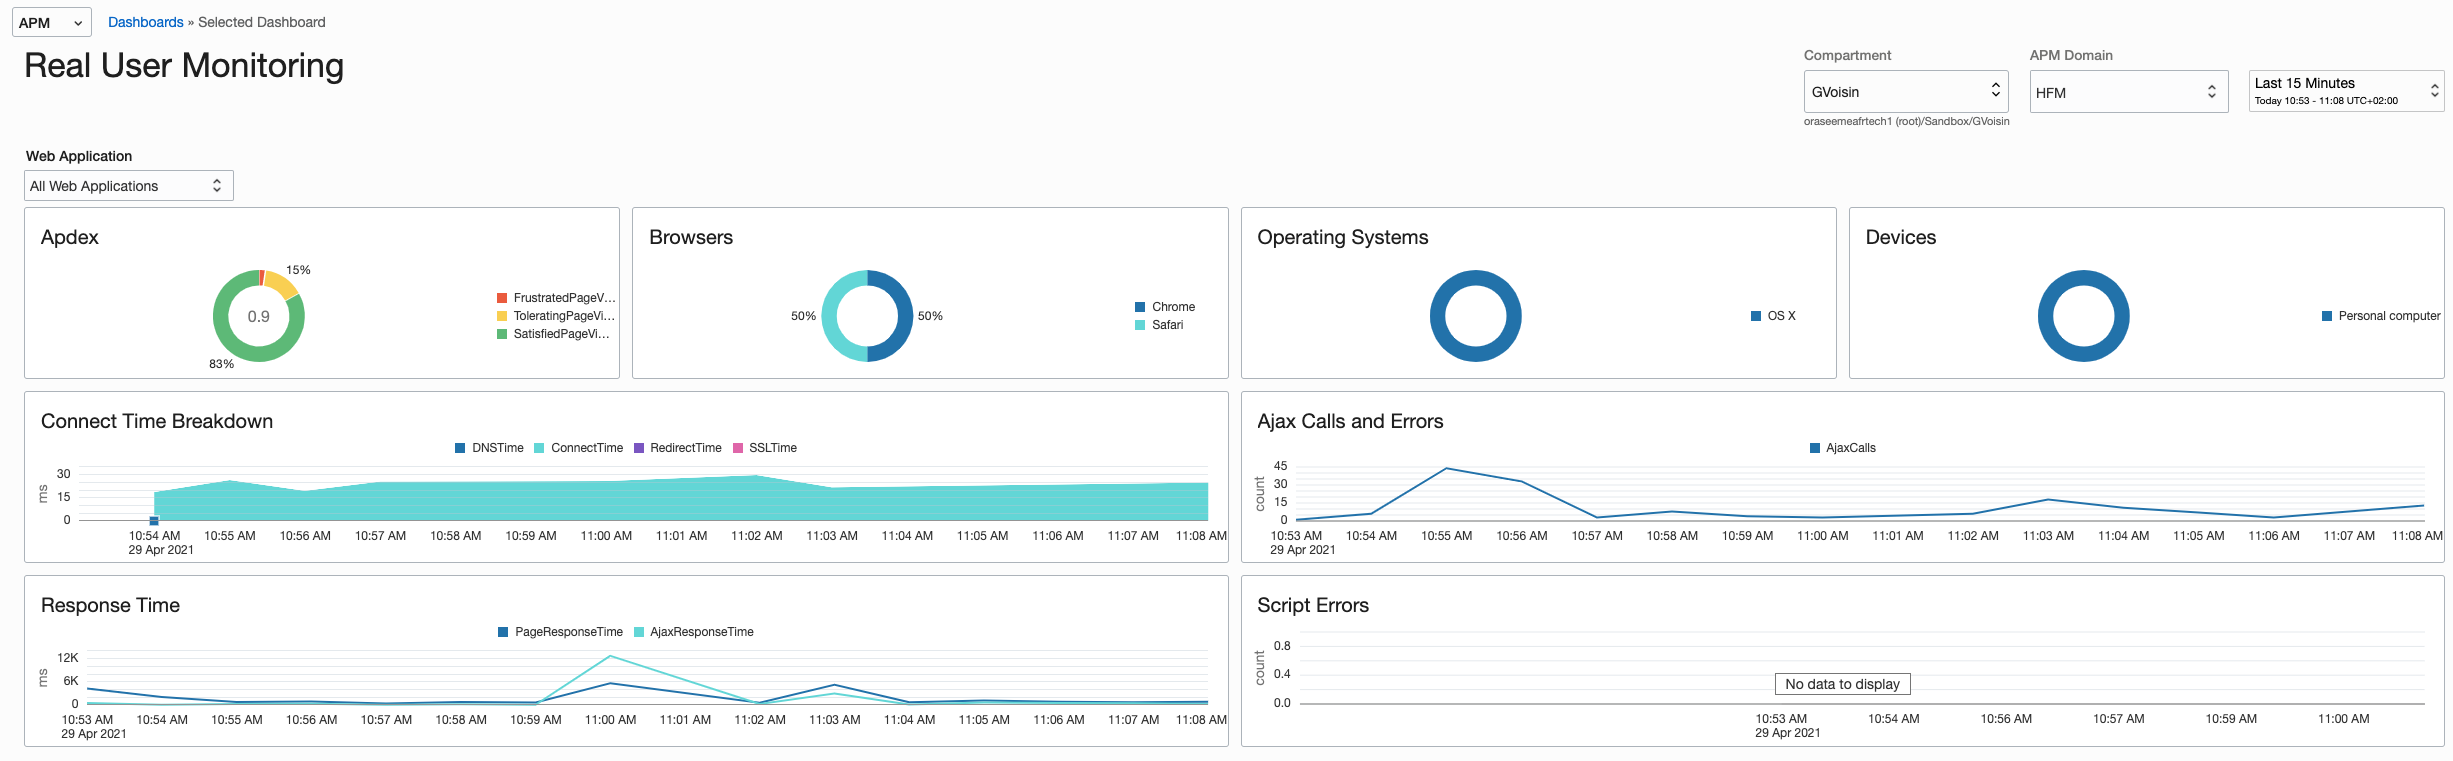
- JD Edwards users activity, with custom metrics including application, version, …:
Note : I already used Google Analytics a few years ago to monitor the front-end users activity; with APM you now have the same possibilities : response time, origins, JDE applications, environments, … And with APM, you can also include the webservers backend activity with the Management Agent which is very easy to set up.
Setup
There are 2 setups needed when you want to monitor both appservers and frontend users:
Install and configure APM Java Agent for JD Edwards web servers
The documentation is very well detailed for this and basically you just need to follow the different steps after having created your APM domain.
check prerequisites:
- JDK 1.7 (documentation says 1.6 but I had some issues with https)
- 200 MB of Java Memory Heap Space => you can add more to your JVM by increasing +Xmx setting
- 200 MB disk Space
- check you application server compatibility; as of today:
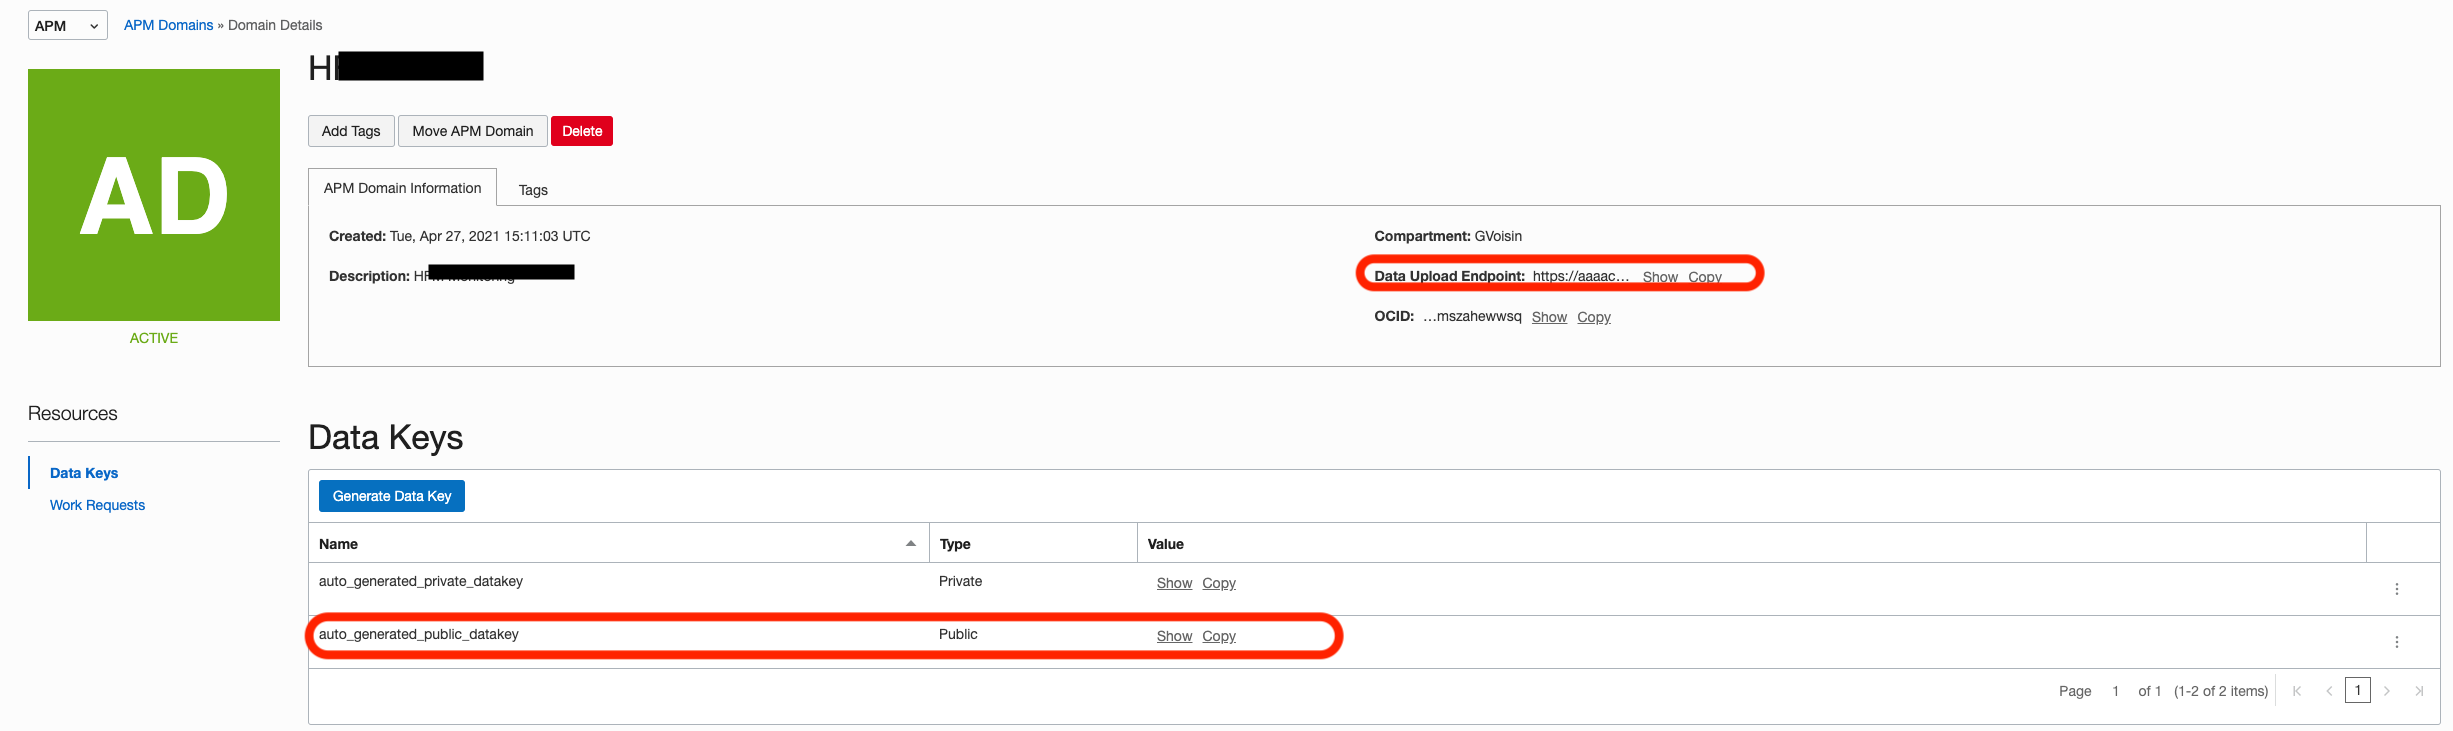
WebLogic 10.3.6, 12.x, 14.x Tomcat 6,7,8,9 TomEE 1.7, 7, 8 Springboot 1.x, 2.x Servlet 1.0 1.0 1.0 1.0 JDBC 1.0 1.0 1.0 1.0 HttpUrlConnection 1.0 1.0 1.0 1.0 Apache HttpClient 4.x 1.0 1.0 1.0 Custom Probe 1.0 1.0 1.0 1.0 retrieve your APM domain private key and data upload endpoint:
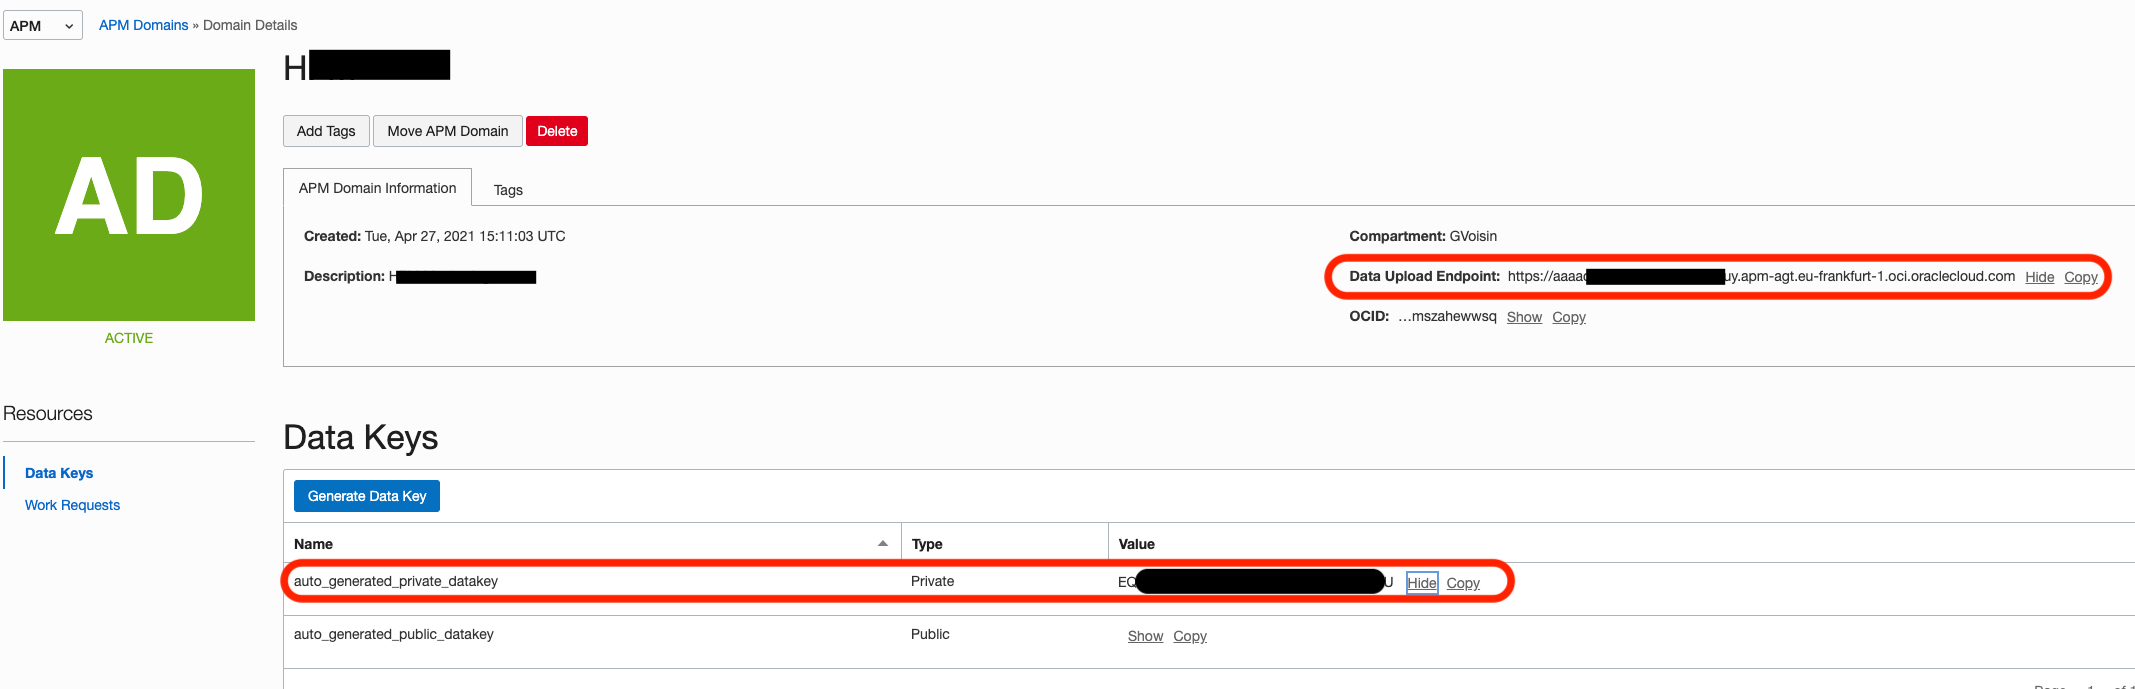
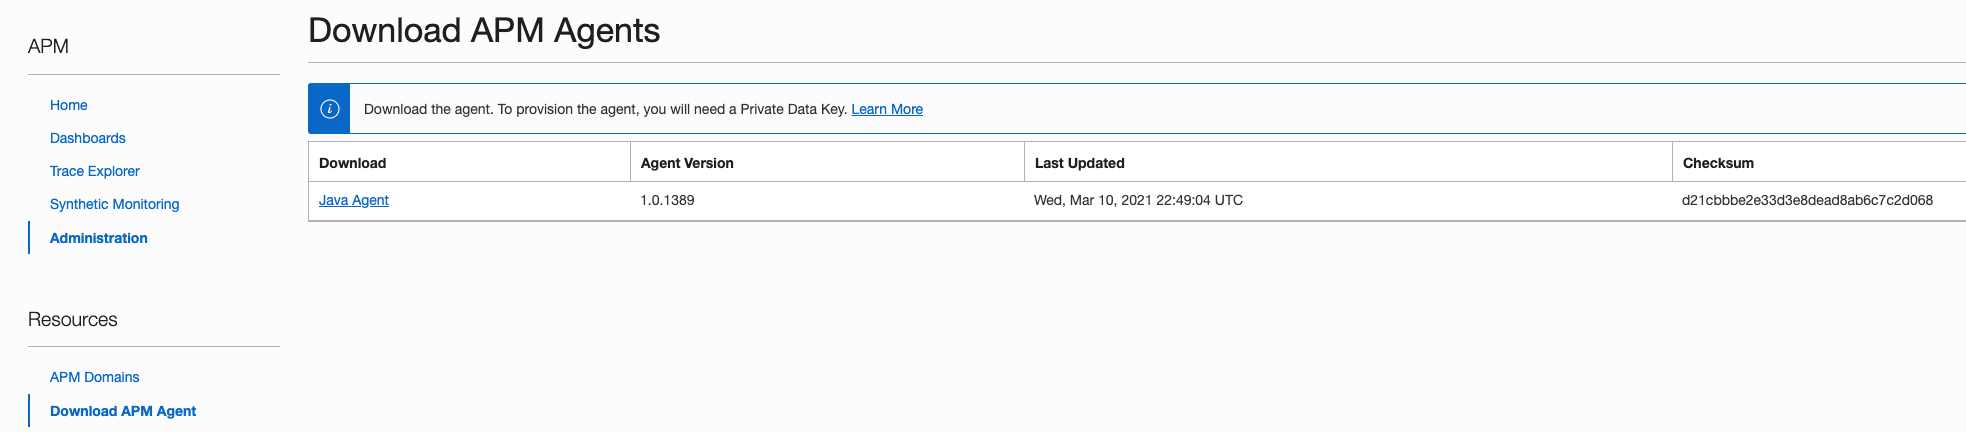
download the agent from the APM domain Administration page; this is a jar file that needs to be copied to your Web server
provision the agent: “provisoning” is mainly the install step; I created this install.sh script to install it on a Oracle Linux 7 server; you only need to define the install folder, the APM domain private key and data upload endpoint:
export JAVA_HOME=/u01/java/1.8.0_162_64bit/jdk
export PATH=$JAVA_HOME/bin:$PATH

java -jar ./apm-java-agent-installer-1.0.1389.jar provision-agent -service-name=apm_jde92 -destination=/u01/apm_agent -private-data-key=<redacted> -data-upload-endpoint=https://<redacted>.apm-agt.eu-frankfurt-1.oci.oraclecloud.com
deploy the agent with your Application Server, WebLogic for JD Edwards; for this part you only need to update the setDomainEnv.sh (or setDomainEnv.cmd) with the -javaagent option pointing to your APM Java Agent install folder; for example I added this line at the end of the script file:
export JAVA_OPTIONS="$JAVA_OPTIONS -javaagent:/u01/apm_agent/oracle-apm-agent/bootstrap/ApmAgent.jar"
Then, restart your WebLogic server; you can verify the logs files in the /logs folder; in my case, for 3 WebLogic servers + an AdminServer running in this domain, I have the following subfolders and log files:
    [oracle@JDETRENT92 log]$ tree /u01/apm_agent/oracle-apm-agent/log
    .
    ├── jdetrent92.xxx.oraclevcn.com_7001_AdminServer
    │   ├── AgentErrors.log
    │   ├── AgentErrors.log.lck
    │   ├── Agent.log
    │   ├── Agent.log.lck
    │   ├── AgentStartup.log
    │   ├── AgentStatus.log
    │   └── AgentStatus.log.lck
    ├── jdetrent92.xxx.oraclevcn.com_8081_JVM_JDETRENT92_HTML_DV_8081
    │   ├── AgentErrors.log
    │   ├── AgentErrors.log.lck
    │   ├── Agent.log
    │   ├── Agent.log.lck
    │   ├── AgentStartup.log
    │   ├── AgentStatus.log
    │   └── AgentStatus.log.lck
    ├── jdetrent92.xxx.oraclevcn.com_8083_JVM_JDETRENT92_AIS_DV_8083
    │   ├── AgentErrors.log
    │   ├── AgentErrors.log.lck
    │   ├── Agent.log
    │   ├── Agent.log.lck
    │   ├── AgentStartup.log
    │   ├── AgentStatus.log
    │   └── AgentStatus.log.lck
    └── jdetrent92.sxxx.oraclevcn.com_8091_JVM_JDETRENT92_HTML_DV_8091
        ├── AgentErrors.log
        ├── AgentErrors.log.lck
        ├── Agent.log
        ├── Agent.log.lck
        ├── AgentStartup.log
        ├── AgentStatus.log
        └── AgentStatus.log.lck
If everything went well, you should start having trace data available in Trace Explorer:
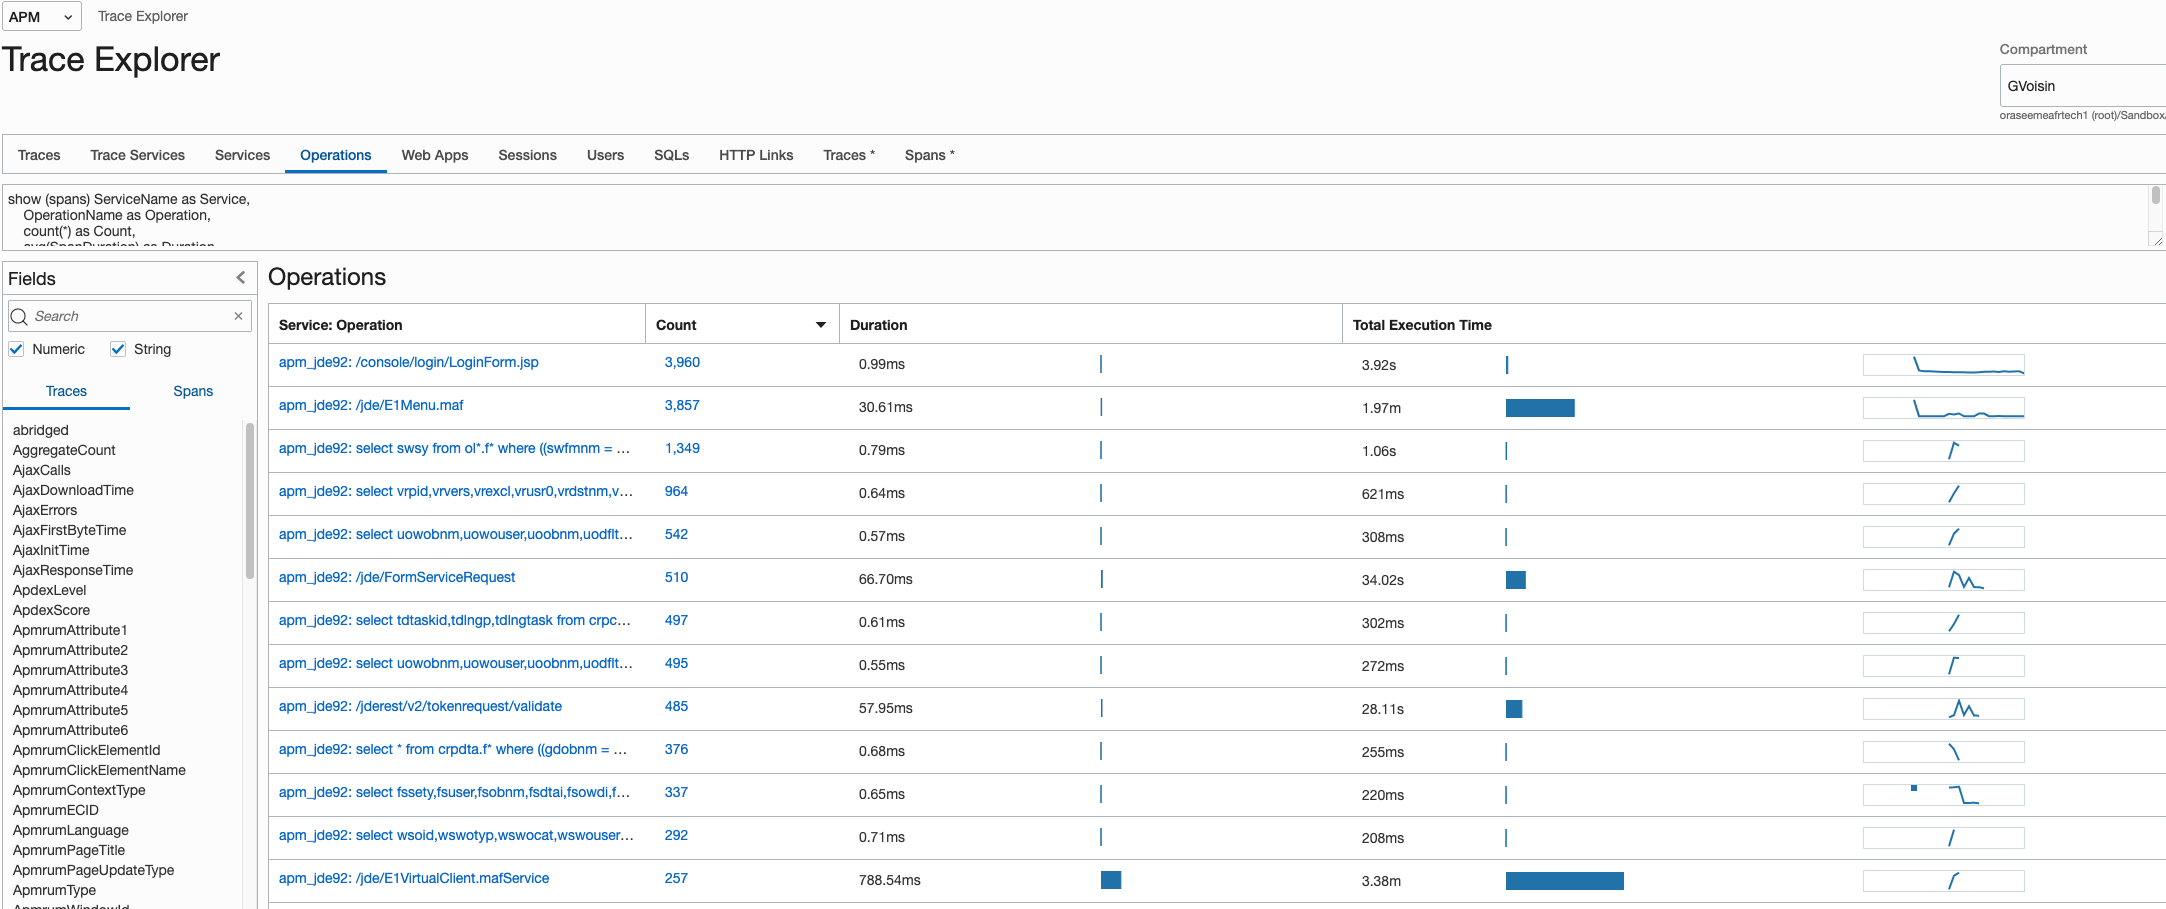
Now you have full traceability inside your JD Edwards Web instance, you can easily pinpoint performance issues, define a standard baseline and detects when you start having performance issues, …
Install APM Browser Agent on JD Edwards servers
This was quite easy as I already did that for Google Analytics a few years ago; all you have to do is update the webgui.js file to load the APM Browser Javascript and define the custom metrics you want to monitor.
Here is the code I added at the end of the webgui.js file:
// Import APM javascript and insert it into the page
(function() {
  var po = document.createElement('script');
  po.type = 'text/javascript';
  po.async = true;
  po.src = 'https://aaaac6<redacted>.apm-agt.eu-frankfurt-1.oci.oraclecloud.com/static/jslib/apmrum.min.js';
  var s = document.getElementsByTagName('script')[0];
  s.parentNode.insertBefore(po, s);
})();

// Define APM settings and data upload endpoint
window.apmrum = (window.apmrum || {});
window.apmrum.serviceName='apm_jdebrower';
window.apmrum.webApplication='jde_dv920';
window.apmrum.ociDataUploadEndpoint='https://aaaac6<redacted>.apm-agt.eu-frankfurt-1.oci.oraclecloud.com';
window.apmrum.OracleAPMPublicDataKey='<redacted>';
window.apmrum.trackScreenText=true;

// Create a listener to refresh metrics on each page change
window.addEventListener("load", function() {
var appId = document.getElementById('formOID');

if ((typeof getUserId !== 'undefined') && (typeof getUserName !== 'undefined') && (typeof getEnvironment !== 'undefined') )
{
  window.apmrum.username = getUserId();
  let envJde = getEnvironment();
  apmrum.udfAttribute2 = function()
  {
      // return desired value of attribute 1
    return envJde;
  };
}

if (appId) {
    console.log(appId)
    let appJde = appId.innerHTML.split('_')[0];
    let versJde = appId.innerHTML.split('_')[2];
    let formJde = appId.innerHTML.split('_')[1];
    console.log(appJde);
    window.apmrum.udfAttribute3 = function() {
      return appJde;
    }
    window.apmrum.udfAttribute6 = function() {
      return appJde;
    }
    window.apmrum.udfAttribute4 = function() {
      return versJde;
    }
    window.apmrum.udfAttribute5 = function() {
      return formJde;
    }
}

});
If you want to test it in your environment you just need to replace the APM endpoint and Public Key with the one you can find on your APM domain:
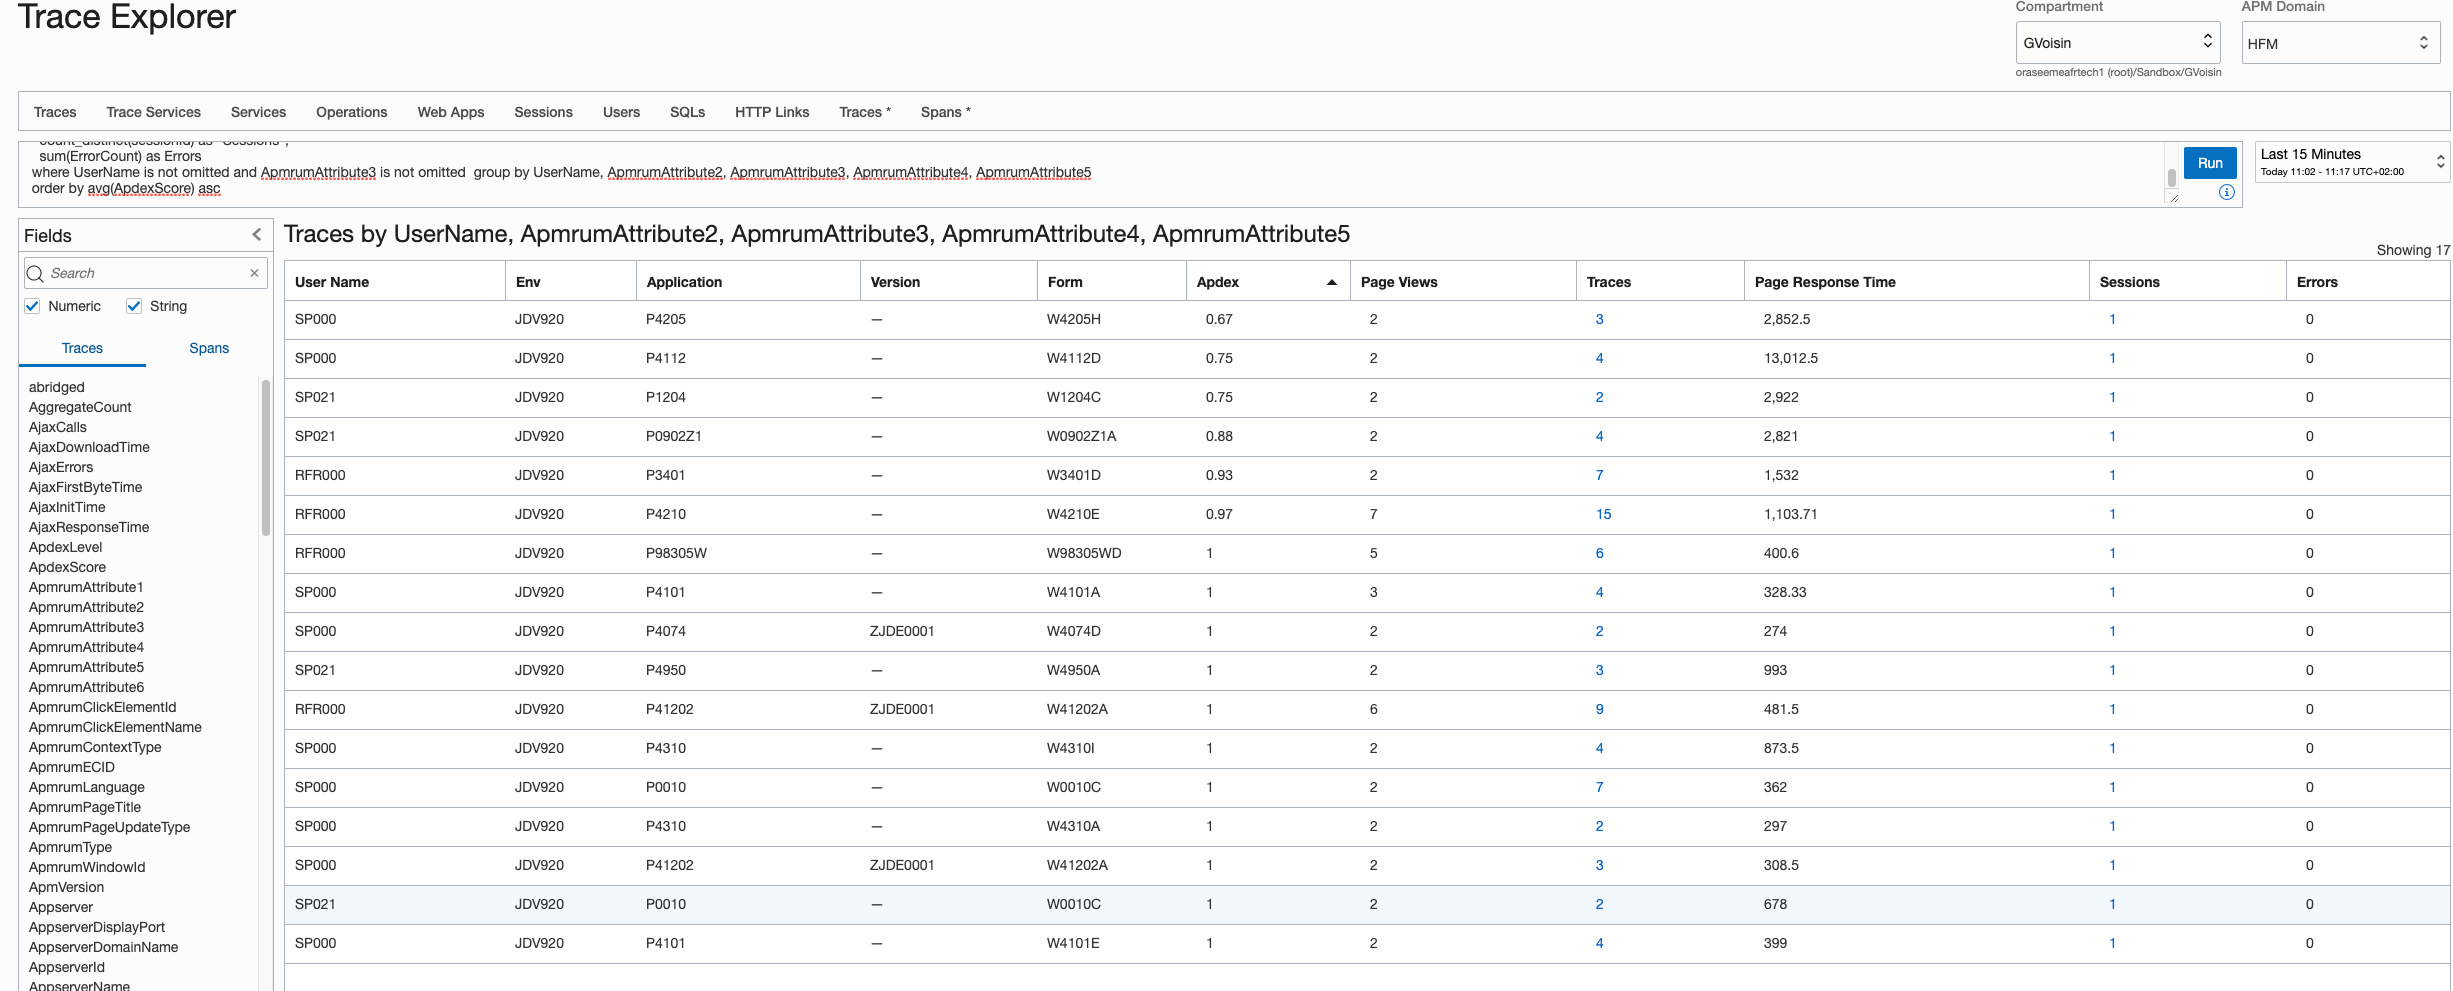
After logging some activity, you can visualize the users activity with the following query in Trace Explorer:
show (traces) UserName as "User Name", ApmrumAttribute2  as "Env", ApmrumAttribute3 as "Application", ApmrumAttribute4  as "Version", ApmrumAttribute5  as "Form",
  avg(ApdexScore) as Apdex,
  sum(PageViews) as "Page Views",
  count(*) as "Traces",
  avg(PageResponseTime) as "Page Response Time",
  count_distinct(sessionId) as "Sessions",
  sum(ErrorCount) as Errors
where UserName is not omitted and ApmrumAttribute3 is not omitted  group by UserName, ApmrumAttribute2, ApmrumAttribute3, ApmrumAttribute4, ApmrumAttribute5
order by by UserName, avg(ApdexScore) asc
And that’s it ! In this article I described the first use cases you can easily implement and start monitoring your JD Edwards platform. This is just the first step and there are other features in Observability & Management Platform you can then implement to achieve a full monitoring of your JD Edwards: Logging Analytics, Database Management, …
I’ll create another post shortly to cover those features and help you implement them.