
Prometheus exporters to monitor Oracle Cloud Infrastructure
3 years ago I started having a look at Go and going through a few Getting Started tutorials. Instead of learning with standard exercices I decided to develop my own small applications based on a use case I had at the time : my company back then was hosting more & more of its JD Edwards customers on Oracle Cloud Infrastructure (OCI) and asked me if we could provide a centralized monitoring solution to our Ops team: a Monitoring Solution which could cover the whole stacks : from infrastructure, to end user experience. At the time I already built a prototype with Grafana, Prometheus and a few exporters but we were missing 2 crucial parts:
- metrics from JD Edwards Server Manager (web console to administer the JDE stack)
- metrics from OCI to retrieve the instances status
As Prometheus is developed in Go, like many of its exporters, I decided to apply my newly acquired, fragile, knowledge with this language to develop 2 projects:
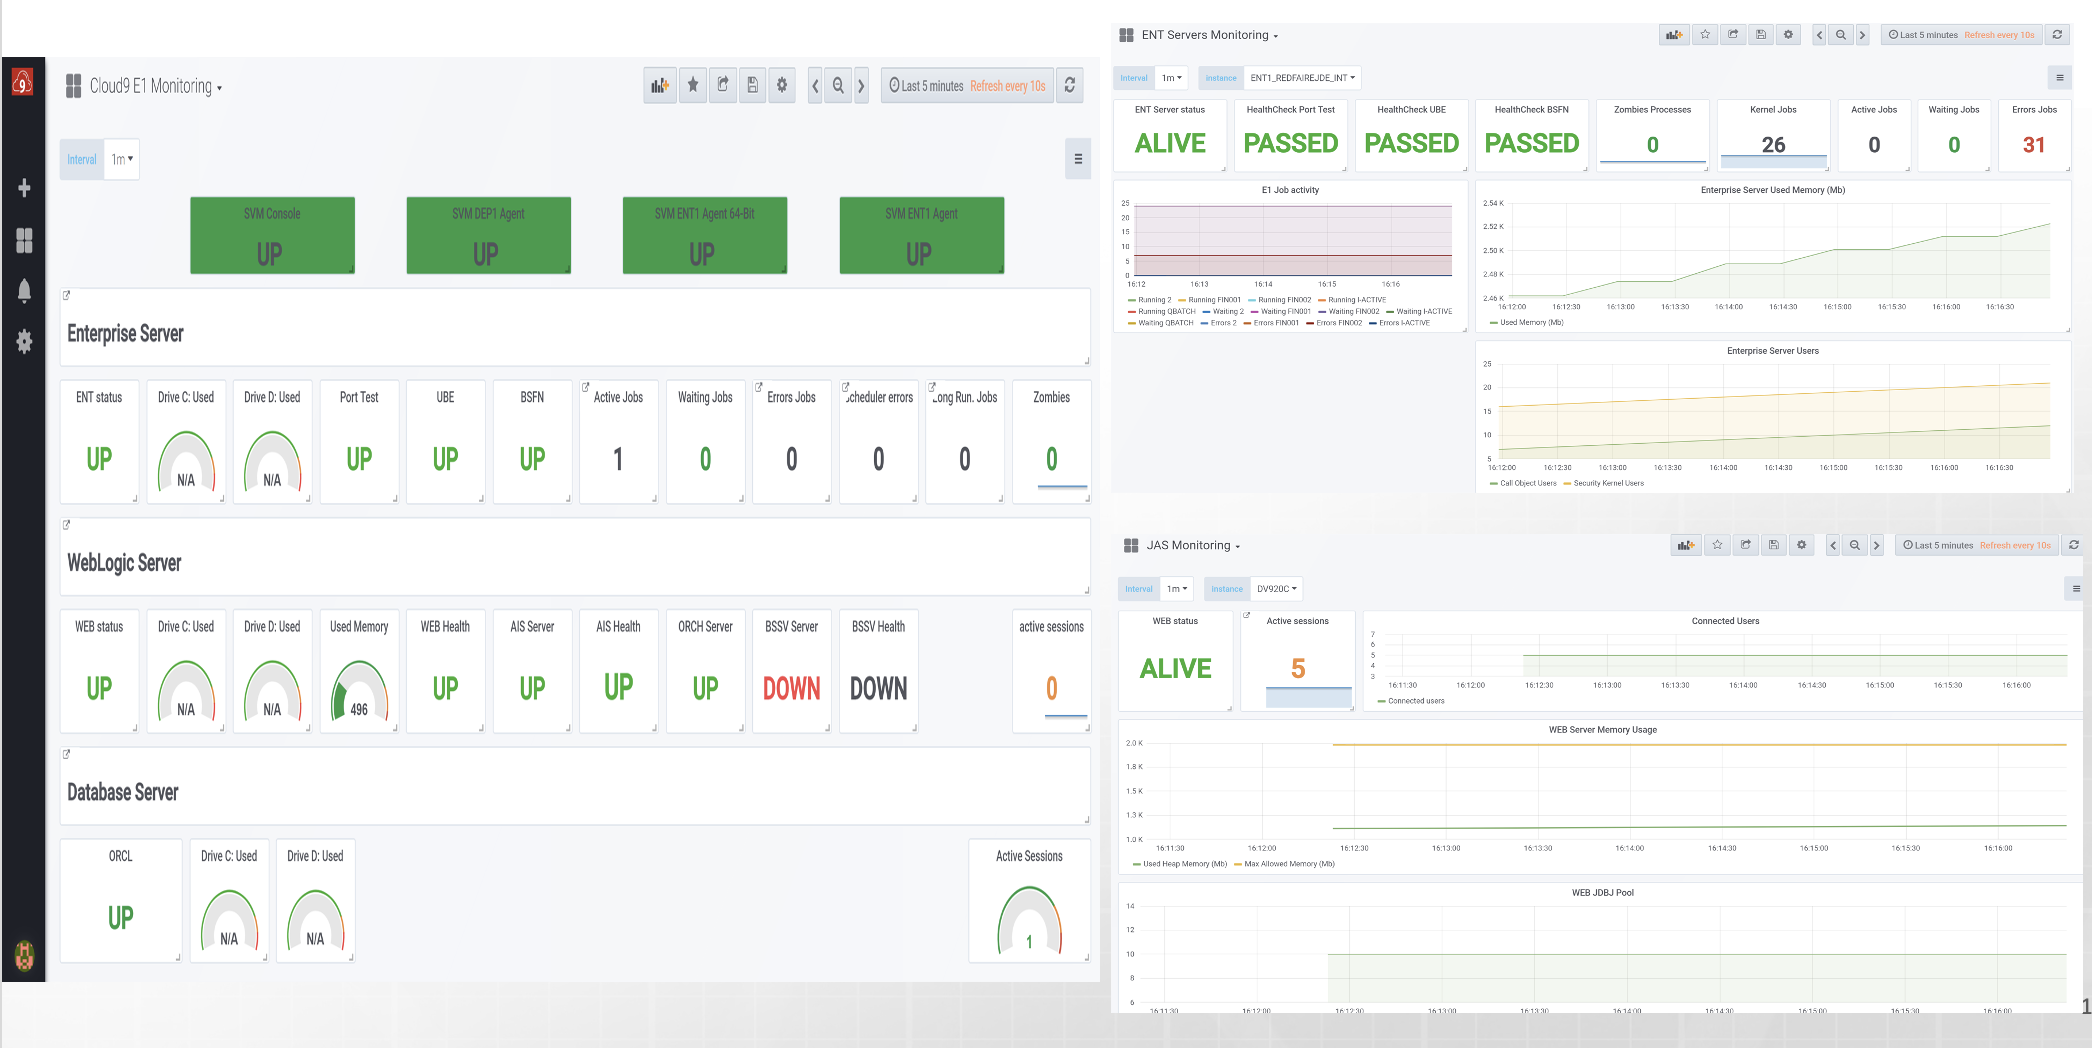
- e1exporter to retrieve metrics from Server Manager REST API : CPU activity, memory usage, user activity, weblogic status, health checks, …
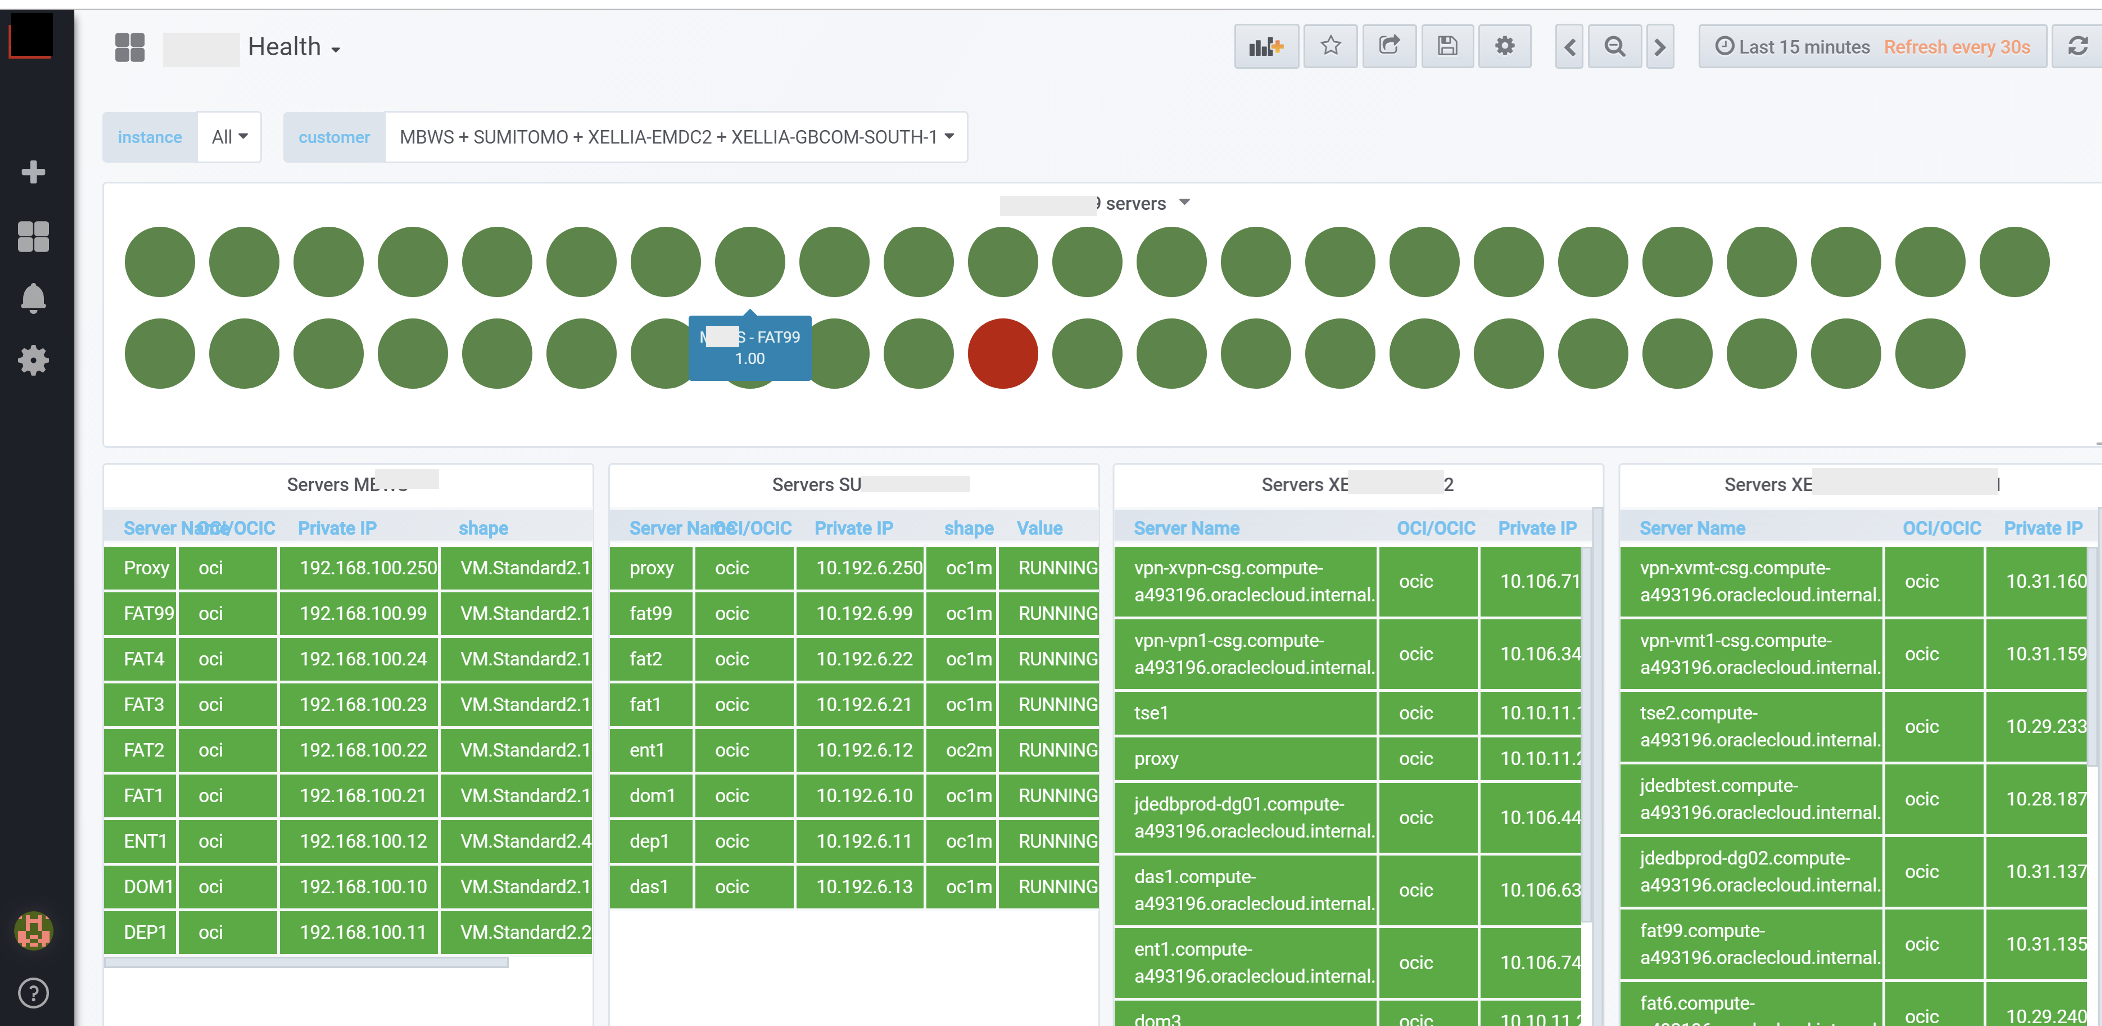
- ociexporter to retrieve mainly the instances state : UP or DOWN
NOTE: I also developed ocicexporter to retrieve instances metrics from OCI Classic as we had customers on this First-Generation Oracle Public Cloud but it is deprecated now. Getting the authentication right was a real challenge for this one !
It was really fun and educative to work on those Go projects as it gave me the opportunity to better understand at the same time Go and the OCI & Server Manager Rest APIs.
I started initially from scratch but soon discovered the HAProxy Exporter for Prometheus which helped me greatly with my project. The official documentation on how to write your own Prometheus exporter was also very good at the time and still is.
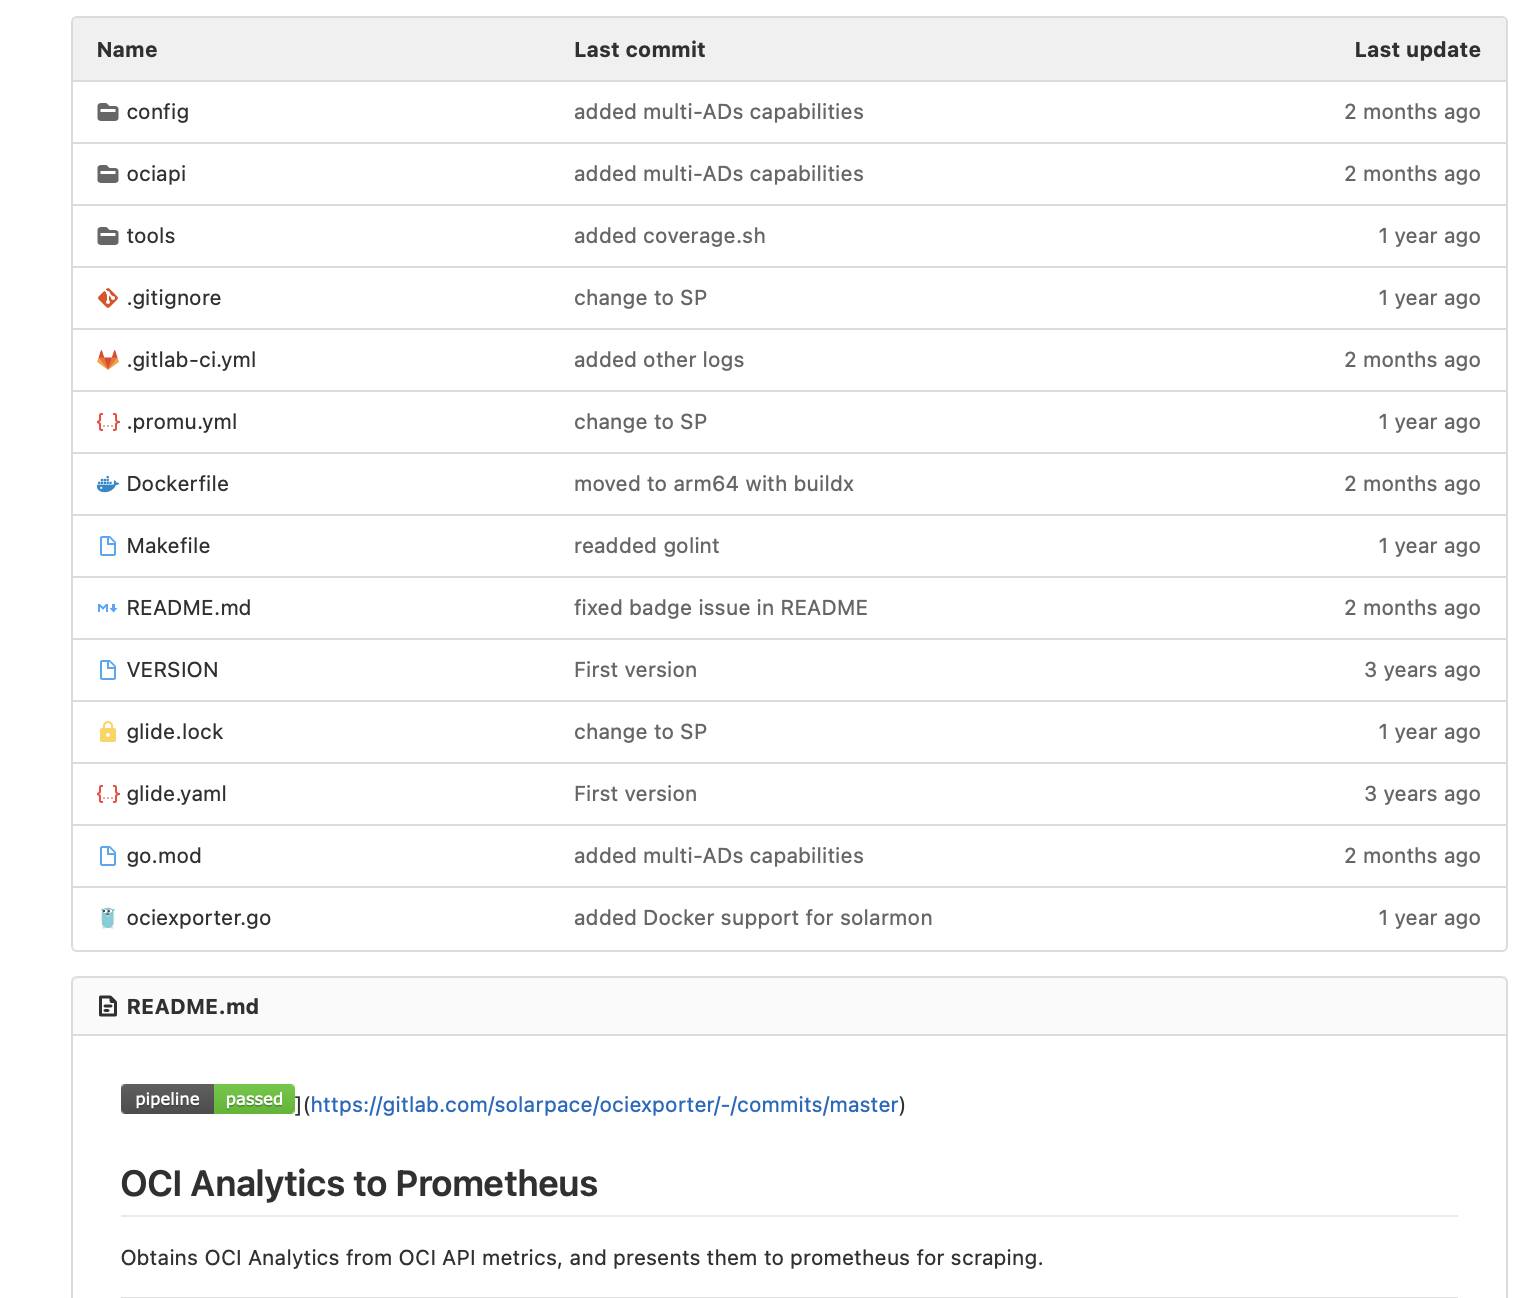
You can find the source code here if you want : ociexporter.
Please be tolerant, this is not great coding; I am no developer and especially no Go developer at the time but it does what I expected it to do : list all OCI instances in a compartment and tells me if they were alive or not so I can display a centralized dashboard to our Ops Team.
The next Prometheus exporter I developed, e1exporter, is much more advanced (but still with poor coding I must say) as it calls multiple Server Manager APIs to retrieve all the metrics needed to monitor a JD Edwards platform. I should write another post about it and make the project public when I have time to clean it a little bit and write some documentation around it.
Here is a small preview of the dashboards we were able to create with those metrics:
Note CI/CD
You can also find in the code repository the .gitlab-ci.yml and Dockerfile as I couldn’t resist the opportunity automate the development and deployment process : the pipeline builds a Docker image and stores it in GitLab registry where a Portainer instance would retrieve and update the latest version automatically